Acta Universitatis Danubius. Œconomica, Vol 14, No 4 (2018)
ISSN: 2065-0175 Œconomica
Assessing the State of Financial Distress of Listed Gold and Platinum Mining Companies in South Africa
Sam Ngwenya1
Abstract: The main objective of this study was to assess the state of financial distress of listed gold and platinum mining companies in South Africa during the period 2011 to 2015. Mining has been the driving force of the economy in South Africa, and has played a vital role in the country′s economic development. Most studies conducted on financial distress in South Africa focussed on manufacturing companies, and none could be found that focussed on mining companies. Out of a population of 8 listed gold mining companies and 11 listed platinum mining companies, only 5 gold mining companies and 5 platinum mining companies were selected to form a total sample of 10 gold and platinum mining companies. Standardised financial statements of the sampled gold and platinum mining companies was downloaded from iNET BFA database and analysed making use of Altman Z-score and Altman Z′ (EM) score models as proxies to predict financial distress. The results revealed that gold miningcompanies are more financially distressed than platinum mining companies. It is recommended that management in gold and platinum mining companies should conduct regular ratio analyses and take corrective action where necessary to improve the financial health of the companies.
Keywords: Financial Distress; gold and platinum mining companies; Altman Z-score; Altman Z′ (EM) score; Johannesburg Securities Exchange
JEL Classification: G3; G31
1. Introduction
Financial distress is a term used in corporate finance to indicate that a company is unable to meet scheduled payments or that cash flow projections indicate that a company will soon be unable to meet scheduled payments. (Brigham & Daves, 2004) Financial distress is defined in Section 128 of the Companies Act of 2008 as a state of a company that appears to be reasonably unlikely that it will be able to pay all of its debts as they become due and payable within the immediately ensuing six months, or that it is likely that the company will become insolvent within the immediately ensuing six months.
Elloumi and Gueyie (2001) define financial distress as a condition whereby a firm’s business deteriorates to the point where it cannot meet its financial obligations. Khaliq, Altarturi, Thaker, Harun and Nahar (2014) define financial distress as the situation when a company cannot meet or face difficulty in paying off its financial obligations to creditors. If financial distress cannot be relieved, it may lead to financial failure. Financial failure may take the form of bankruptcy or insolvency. Insolvency means that a company is unable to meet its current obligations when they are due, which happens when the current liabilities exceed the current assets. On the other hand, bankruptcy happens when a company’s current liabilities exceed the fair value of its assets. (Mohammed & Soon, 2012)
The ability to predict company failure is particularly important from both the private investors and management’s viewpoint as it might be an indication of resource misallocation. (Mahama, 2015) Financial difficulties of companies should be analysed in advance to avoid high profile bankruptcy. Assessment of bankruptcy provides invaluable information on which governments, investors, shareholders, management and other stakeholders can base their financial decisions in order to prevent possible losses. (Shetty, Pakkala & Mallikarjunappa, 2012) XU, ZHAO and BAO (2015) concurs with Mahama (2015) and Shetty, Pakkala and Mallikarjunappa (2012) that the establishment of an effective early warning system can assist management to make relevant decisions sooner to improve the financial condition, and also make investors avoid or reduce investment losses. The recent liquidation of companies such as Lehman Brothers, Enron and WorldCom in the US and Nationwide Airlines, Velvet Sky Aviation and 1Time Holdings in South Africa indicates the importance of early detection to prevent business failure. The preliminary report of Stats SA (2014) indicates that 171 businesses were liquidated in January 2014 and six of these businesses came from the mining and quarrying industry.
South Africa is well known of its rich minerals. Mining has been the driving force of the economy and has played a vital role in the country’s economic development, transforming South Africa into the most industrialised country in Africa. The country’s total mining reserves remain the world’s most valuable, with an estimated worth of R20.3-trillion ($2.5-trillion) (South African Year Book, 2012/13). Overall, the country is estimated to have the world’s fifth largest mining sector in terms of gross domestic product (GDP) value (Chamber of Mines of South Africa, 2014). GDP from mining in South Africa averaged R234 360,42 million from 1993 until 2016, reaching an all-time high of R251 119,50 million in the fourth quarter of 2006 and a record low of R214 553,50 million in the first quarter of 2009 (Stats SA, 2016). Employment in the mining sector fell from 489 000 to 457 000 employees from June 2015 to June 2016, representing an annual decrease of 32 000 employees (6.5%) (Stats SA, 2016). The impact of the global financial crisis, the rise in the cost of production of gold and platinum, a decline in production due to strike activity and a drop in the price of gold and platinum has negatively affected the financial health of the gold and platinum mining companies.
Recently a number of gold producers reported huge losses in their financial statements, which resulted in financial failure. Lily Gold Mine recorded a profit of R35 million at the end of the 2015 financial year and a loss of R2.5 million in January 2016 before it was shut down. It is estimated that the company requires funding of R200 million in the form of either debt or equity before it can resume operations. (Yende, 2016) Gold mines that preceded Lily Gold Mine in being liquidated as a result of financial failure include Blyvoor (Matthew, 2014), six subsidiaries of Pamodzi Gold (Creamer, 2009) and Aurora Gold Mine. (Anon, 2011) Figure 1 depicts the monthly production index of gold for the period 1980 to 2015 and figure 2 depicts the five-year gold price in USD/OZ from 2011 to the middle of 2016. The indices provide an indication of the level of production, set against a particular base period. Currently, the index is set to 100 for the base period of 2010. (Stats SA, 2015a)
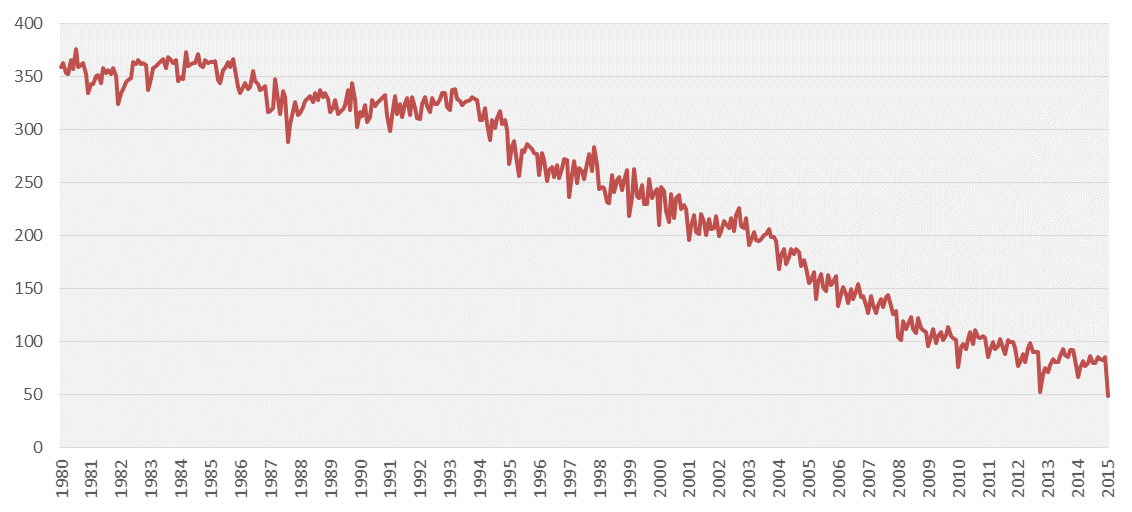
Figure 1. Monthly gold production index, 1980–2015 (Base: 2010=100)
Source: Stats SA (2015a)

Figure 2. Five-year gold price in USD/OZ
Source : http://goldprice.org/gold-price-history.html
From figure 1 it can be seen that gold production decreased over the period 1980 to 2015. The gold production index was 359.0 in January 1980 and fell to the low index of 48.4 in January 2015. This means that South Africa produced 87% less gold in January 2015 compared with the same month in 1980. The fall in production has reduced gold’s contribution to the South African economy – it contributed 3.8% to the GDP in 1993, falling to 1.7% in 2013 (Stats SA, 2014). Figure 2 also indicates that the gold price fell from ± $1 800 in 2011, reaching its lowest through of ± $1 280 in 2015.
The platinum group metals (PGM) sector, measured in GDP, export earnings and contribution to the economy, is one of the largest components of the South African mining sector. South Africa accounted for 71% of the world’s production of platinum. (Loferski, 2013) In 2011 the PGM industry generated R84 billion in sales, was responsible for 36% of the country’s mining exports (17% of total merchandise exports), and had significant direct, indirect and induced multipliers into the rest of the economy, which made it a significant contributor to the fiscus. (Chamber of Mines of South Africa, 2013) The PGM sector employed 194 979 people in 2011, representing an increase of 7% from 2010, with employees earning R30.5 billion in salaries and wages. (Chamber of Mines of South Africa, 2013)
Huge losses were also reported in the financial statements of some platinum mines.
The industry has been hit by the combined impact of slowing global demand, falling prices, rapidly escalating domestic production costs (that added to the high cost structure of the industry) and the impact of the wildcat strikes that started in 2012 and continued into 2013. The platinum mining industry lost around R15.3 billion in output as a result of strikes in 2012. (Chamber of Mines of South Africa, 2013) Despite the significant role and contribution of the PGM sector to the South African economy, the platinum mining industry continues to be in crisis. Anglo American Platinum (Amplats) signed a deal to sell its Rustenburg Platinum Mines to Sibanye Gold for R4.5bn ($331m) due to losses incurred during the five-month strike in 2012 and 2013. The year-end marked the beginning of the restructuring process of Amplats, which included the laying off of 85 000 jobs. (Anglo American News, 2015; Mining-technology.com, 2015)
Similarly, Lonmin PLC found itself facing financial difficulties and mounting debt.
In order to resolve its predicament, the company planned to raise $407 million in a rights issue of new shares, an action that resulted in 85% drop of its share price (shares opened in the market at 31c and closed at R2.02c) (van Rooyen, 2015).
Lonmin’s restructuring, which included the closure of some of its shafts, resulted in the loss of 6 000 jobs (Janse van Vuuren, 2015). Figure 3 illustrates the production of PGM over the period January 2010 to March 2015 and figure 4 illustrates the five-year platinum price in USD/OZ over the period 2011 to mid-2016.

Figure 3. PGM production for the period January 2010 to March 2015
Source: Stats SA (2015b)

Figure 4. Five-year platinum price in USD/OZ
Source: http://www.infomine.com/investment/metal-prices/platinum/5-year/
From Figure 3 it appears that there was a 132.2% increase in the production of PGMin March 2015, which pushed up mining production by 18.8%. However, the risewas due to the “base effect”, that is, the rise was compared with the most recentmonth of January 2014 five month-long strike, yet still lower than production peakof January 2010 (Stats SA, 2015b). Figure 4 indicates that the price of platinum fellfrom ± $1 820 in 2011 and reached the lowest through of ± $850 in the middle of2015. Based on the above information, it may be concluded that both gold andplatinum mining companies experienced financial difficulties during the period 2011to 2015. Consequently, the following question arises: Are listed gold and platinummining companies in South Africa facing financial distress? If so which industry between the gold and platinum mines is the most affected?
Most studies conducted on financial distress were piloted in developed economiesand focused mainly on manufacturing companies. (Gepp & Kumar, 2015; XU, ZHAO & BAO, 2015; Khaliq et al., 2014; Ward, 1994; Ferner & Hamilton, 1987; Lau, 1987; Ohlson, 1980; Altman, Haldeman & Narayan, 1977; Altman, 1968; Beaver, 1966) Studies that focus on mining companies are quite scanty. (Zlatanovic, Bugarin, Milisavljevic & Zlatanovic, 2016; Saden & Prihatiningtias, 2015; Moeljajdi & Indrawati, 2014; Shah, 2014) Studies conducted in South Africa also focus mainlyon manufacturing companies (Hlahla, 2010; Muller, Steyn-Bruwer & Hamman, 2009; Naidoo & du Toit, 2007; Jooste, 2007; Lukhwareni, 2005; Kidane, 2004; Court, Radloff & Van der Walt, 1999; De la Rey, 1981; Daya, 1977), and no studycould be found that focuses purely on the mining industry. This study seeks to narrowthe gap and to contribute to the existing body of literature by assessing the state offinancial distress of listed gold and platinum mining companies in South Africa. Theremainder of this paper is structured as follows: Firstly, a literature review presentsthe theoretical foundation of the study related to company financial distress.
Secondly, the sample, the variables and the methodology employed are outlined.
Thirdly, the analysis is carried out, and lastly, the results of the analysis and therecommendations are outlined.
2. Literature Review
The prediction of corporate failure has been a central topic of studies for many decades. The recent global financial crisis, which began in the US in 2008, caused many companies with historically strong financial standings to go out of businessbecause they were caught off guard and could not meet their financial obligations.
The high profile corporate collapses that either contributed to the global financial crisis or that was a consequence of the crisis, such as the collapse of Lehman Brothers, increased the need to understand the reasons behind the collapse of a company to ensure timely bankruptcy preventative action can be taken. High profile company failures, which included companies such as Nationwide Airlines, Velvet Sky Aviation and 1Time Holdings to mention a few, were also reported in South Africa. Gepp and Kumar (2015) suggest that accurate prior warning of business failure will promote economic stability and reduce costly contagious effects whereby one business failure resulted in many businesses failing as observed during the recent global financial crisis.
Previous studies conducted on financial distress used various predictive models. Beaver (1966), the pioneer of studies on company failure, used a univariate dichotomous classification test to identify financial ratios that could classify companies as failure or successful. He used 30 financial ratios in a sample of 79 failed companies and 79 successful companies. The working capital/debt ratio and net income/total asset ratio were found to be the best discriminant factor that correctly identified company failure at 90% and 88% respectively. Beaver’s study paved the way for the development of a statistical model to predict financial failure.
Altman (1968) used a multivariate discriminant analysis (MDA) on a sample of 66 companies, of which 33 were failed companies and 33 were successful companies.
The model was accurate in classifying 95% of the total sample correctly one year prior to failure. The main contribution of his study was the design of the Z-score model, which has been widely accepted globally as a reliable model to accurately predict financial distress for companies listed on capital markets. Ferner and Hamilton (1987) also used the MDA to predict financial distress in New Zealand listed companies. Ohlson (1980) used the logit model to predict business failure with a sample of 105 bankrupt companies and 2 058 non-failing companies. Out of a total of nine financial ratios included in the model, he found that size, current liquidity, performance and financial structure accurately predict financial failure.
Premachandra, Chen and Watson (2011) used a data envelopment analysis (DEA) model as a tool for predicting corporate failure and success. The results indicated that the DEA model is relatively weak in predicting corporate failures. Gepp and Kumar (2015) used decision tree software called Classification and Regression Trees (CART) and the results provided empirical evidence to support the use of survival analysis and decision tree techniques in financial distress warning systems that are useful to most entities in the financial market. Low, Nor and Yatim (2001) used the logit model in Malaysia and the results indicated that the probability of financial distress is directly related to the ratio of sales to current assets (S/CA), the ratio of current assets to current liabilities (CA/CL) and the percentage change in net income (CHGNI) of a company. XU, ZHAO and BAO (2015) used the partial least-squares logistic regression model to analyse the early warnings of financial distress on listed companies in the real estate industry in China, the results revealed that the partial least-squires logistic model is stronger in identifying early warning indicators of financial distress due to its elimination of multicollinearity problem as compared to the common logistic regression model. Other studies conducted in developed countries used a composite rule induction system (CRIS) as a company failure predictive model (Ko, Blocher & Lin, 2001), a non-linear artificial neural network (ANN) (Gunay & Ozkan, 2007), and a distance to default (D2D) model. (Miller & Harrington, 2009)
Studies conducted on mining companies also used various financial distress predicting models. Studies that used the Altman Z-score model include a study on a sample of two mining companies in Serbia by Zlatanovic et al. (2016). The results indicated that one of the two mines was in a state of financial distress. A study by Saden and Prihatiningtias (2015) focused on 18 different mining companies listed on the Indonesian Stock Exchange, where some mining companies appeared to show signs of financial distress. Other studies that used different financial distress predicting models include a study by Shah (2014), which focused on Australian mining companies, and a study by Moeljadi and Indrawati (2014), which focused on Indonesian mining companies.
Studies conducted in South Africa used various financial distress predictive methods. Hlahla (2010) conducted a study on a sample of 28 companies listed on the Johannesburg Securities Exchange (JSE). The companies in question were grouped into failed and non-failed companies by means of multiple discriminant analysis following normality tests. Three variables, namely, times interest earned, cash to debt and working capital to turnover were found to be significant. The model correctly classified about 75% of failed and non-failed companies in the original and cross-validation procedures.
Naidoo and du Toit (2007) used a two-stage approach to analyse the financial distress of listed companies. In the first stage, multi-state models were developed to predict the state of health of a company. In the second stage, a contemporary approach was used to produce underlying information or clues, independent of the first stage model, so as to enable management to establish a more meaningful state of the company. The models accurately predicted the financial health of the sampled companies. Other studies conducted in South Africa that used different methods to predict financial failure includes Daya (1977), De la Rey (1981), Court et al. (1999), Kidane (2004), Lukhwareni (2005), Jooste (2007), and Muller et al. (2008).
3. Research Objectives
The main objective of this study was to assess the state of financial distress of listed gold and platinum mining companies in South Africa during the period 2011 to 2015. This study differs from other studies conducted on financial distress in South Africa, in that it focuses on gold and platinum mining companies.
4. Research Methodology
4.1. Data collection, variables and hypotheses
The population of the study consisted of all gold and platinum mining companies listed on the JSE. Out of the population of 8 listed gold mining companies and 11 listed platinum mining companies, only 5 gold mining companies and 5 platinum mining companies were selected to form a total sample of 10 gold and platinum mining companies. The selection criterion was to include only companies that were listed during the period of the study (2011-2015). Further, companies with incomplete data were rejected. Secondary data used in the empirical study was obtained from two sources. Firstly, data was downloaded from the iNET BFA website to obtain standardised financial statements of the listed gold and platinum mining companies. Secondly, the Bloomberg terminal was used to obtain information such as retain earnings and market value per share. Secondary data was downloaded for the period 2011 to 2015, thus allowing five years of uninterrupted observation. This period was deliberately chosen because it reflects the period immediately after the global financial crisis that began in the middle of 2007 and the labour unrest in the mining sector that began in 2012 and resulted in a five-month strike, the longest in South Africa’s mining history, which ended in 2013.
4.2. Variables Used To Measure Financial Distress In Gold And Platinum Mining Companies
Although mining companies in South Africa conform to the International Financial Reporting Standards (IFRS), due to the complex nature of their financial statements, and the fact that operations of mining companies differ according to the phase of operations (exploration, evaluation, development, production, closure and rehabilitation), this study adopted two Altman models, namely, the Z-score model (Model 1), which is used often for companies listed on capital markets, and the modified Z′(EM)-score model (Model 2), which was devised to evaluate non-manufacturers and companies in emerging markets to assess the financial distress of listed gold and platinum mining companies. The formula of the Z-score model is as follows:
Z = 1.2X1+1.4X2+3.3X3+0.6X4+1.0X5
Where:
X1 = Working Capital / Total Assets
X2 = Retained Earnings / Total Assets
X3 = Earnings before Interest and Taxes (EBIT)/ Total Assets
X4 = Market Value of Equity/Total Liabilities
X5 = Sales / Total Assets
The details of the variables are:
X1: The Working Capital/Total Assets ratio is a liquidity ratio that measures the net liquid assets (the difference between current assets and current liabilities) of a company’s total capital. X2: The Retained Earnings/Total Assets ratio measures the leverage of a company, that is, how much of the assets are financed by the company’s own fund. Retained earnings occur when ordinary shareholders allow companies to reinvest profits distributed as dividends. The larger the ratio of the retained earnings of a company in relative to the total assets, the less debt is utilised by the company due to the retention of profits.
X3: The EBIT/Total Assets ratio indicates a company’s ability to generate profits from its assets before interest payments and taxes.
X4: The Market Value of Equity to Book Value of Total Liabilities ratio is a solvency ratio whereby the maximum fall in a company’s equity value before the company falls under the “insolvent” category is established. The market value of the equity is obtained by multiplying the number of both ordinary and preference shares, whereas the total liabilities include both long-term and short-term liabilities stated in the annual report.
X5: The Sales to Total Assets ratio describes the ability of a company’s assets in
producing sales.
If a firm’s Z-score is above 2.99, the firm is healthy and if the Z-score is below 1.81, the firm is viewed as a failing business. Values ranging from 1.81 to 2.99 represent the so-called grey area, which is when there is no clear prediction about financial failure. (Altman 1968; 2002) In the modified Z′ (EM)-score model, the sales/total assets ratio is excluded and the market value of equity is replaced by the book value of equity as follows:
Z′ (EM) = 6.56X1+3.26X2+6.72X3+1.0X4
Where:
X1 = Working Capital / Total Assets,
X2 = Retained Earnings / Total Assets,
X3 = Earnings before Interest and Taxes (EBIT)/ Total Assets,
X4 = Book Value of Equity/Total Liabilities
4.3. Hypothesis
Taking into consideration the reports of liquidation and closure of some gold mines in South Africa and the planned restructuring of platinum mines such as Anglo American Platinum and Lonmin PLC, the hypothesis of the study was thus stipulated as follows:
H0: Gold mining companies are more financially distressed (have the lowest Z-score ratio) than platinum mining companies
H1: Gold mining companies are less financially distressed (have the highest Z-score ratio) than platinum mining companies
5. Results
5.1. Descriptive Statistics
Tables 1 and 2 depict the descriptive statistics of gold and platinum mining companies that were calculated by means of the Altman Z-score model (Model 1), and tables 3 and 4 depict the descriptive statistics of gold and platinum mining companies that were calculated using the Altman Z′ (EM)-score model (Model 2) (refer to Annexures 1 to 4 for the computations). The descriptive statistics are divided into three panels. Panel A depicts the descriptive statistics of the gold mining companies, Panel B depicts the descriptive statistics of the platinum mining companies and Panel C depicts the descriptive statistics of the total sample of gold and platinum mining companies.
Table 1. Descriptive statistics (Z-Score model - Model 1)
Panel A: Gold mining companies, (N=5) |
||||
|
Minimum |
Maximum |
Mean |
Std. Deviation |
2011 |
-1.7155 |
-0.9084 |
-1.3265 |
0.3593 |
2012 |
65.0359 |
697.7153 |
326.7406 |
254.1500 |
2013 |
-0.0798 |
0.0834 |
-0.0005 |
0.0616 |
2014 |
-1.3289 |
-0.0492 |
-0.5778 |
0.6107 |
2015 |
-0.2403 |
0.2909 |
0.0473 |
0.2184 |
Panel B: Platinum mining companies, (N=5) |
||||
2011 |
0.2446 |
0.9501 |
0.5361 |
0.2831 |
2012 |
-1.0977 |
0.8272 |
0.1719 |
0.7706 |
2013 |
0.6295 |
1.1782 |
0.8587 |
0.2158 |
2014 |
0.0019 |
0.4787 |
0.2809 |
0.2336 |
2015 |
-674.8060 |
1358.5800 |
-92.4798 |
833.5767 |
Table 2. Descriptive statistics (Z-score model-Model 1)
Panel C: Gold and Platinum mining companies, (N=10) |
||||
|
Minimum |
Maximum |
Mean |
Std. Deviation |
2011 |
-1.7155 |
0.9501 |
-0.3952 |
1.0279 |
2012 |
-1.0977 |
697.7153 |
163.4561 |
241.5204 |
2013 |
-0.0798 |
1.1782 |
0.4291 |
0.4769 |
2014 |
-1.3289 |
0.4787 |
-0.1485 |
0.6283 |
2015 |
-674.8060 |
1358.5800 |
-46.2162 |
557.8534 |
Table 3. Descriptive statistics (Z′ (EM) score model - Model 2)
Panel A: Gold mining companies, (N=5) |
|||||
|
Minimum |
Maximum |
Mean |
Std. Deviation |
|
2011 |
-3.6115 |
-1.7919 |
-2.8164 |
0.7787 |
|
2012 |
320.0970 |
1150.0358 |
671.7818 |
319.2815 |
|
2013 |
1.1752 |
2.1981 |
1.5993 |
0.3834 |
|
2014 |
-8.1048 |
-0.6236 |
-3.4895 |
3.6747 |
|
2015 |
-0.1652 |
0.8681 |
0.4049 |
0.3848 |
|
Panel B: Platinum mining companies, (N=5) |
|||||
2011 |
1.0668 |
2.1505 |
1.6192 |
0.3954 |
|
2012 |
-1.0283 |
1.8934 |
1.1395 |
1.2413 |
|
2013 |
1.9286 |
2.9592 |
2.3958 |
0.3916 |
|
2014 |
0.6234 |
1.4190 |
1.0687 |
0.3429 |
|
2015 |
0.6493 |
1.6008 |
1.2551 |
0.3662 |
|
Table 4. Descriptive statistics (Z′ (EM) score model-Model 2)
Panel C: Gold and Platinum mining companies, (N=10) |
||||
|
Minimum |
Maximum |
Mean |
Std. Deviation |
2011 |
-3.6115 |
2.1505 |
-0.5986 |
2.4092 |
2012 |
-1.0283 |
1150.0358 |
336.4606 |
412.6031 |
2013 |
1.1752 |
2.9592 |
1.9975 |
0.5565 |
2014 |
-8.1048 |
1.4190 |
-1.2104 |
3.4388 |
2015 |
-0.1652 |
1.6008 |
0.8300 |
0.5711 |
From table 1 it can be seen that the mean Z-score of the gold mining companies recorded a maximum value of 697. 715 in 2012 and a minimum value of -1.7155 in 2011. Except for the year 2012, the mean Z-score recorded the lowest figure of -1.3265 in 2011, which may indicate that the gold mining companies were financially distressed in 2011. The platinum mining companies recorded a maximum mean Z-score of 1.1782 in 2013 and a minimum of -674.8060 in 2015, as depicted in table 1. The mean Z-scores recorded the lowest figure -92.4798 in 2015. This may indicate that the platinum mining companies were financially distressed in 2015.
From table 2 it can be seen that the mean Z-score of both gold and platinum mining companies recorded a maximum value of 697.7153 in 2012 and a minimum value of -674.8060 in 2015. The mean Z-score recorded the highest figure of 163.4561 in 2012 and the lowest figure of -46.2162 in 2015. This may indicate that both gold and platinum mining companies were financially distressed in 2015.
The gold mining companies as depicted in table 3 recorded a maximum mean Z′ (EM)-score of 1 150.0358 in 2012 and a minimum of -8.1048 in 2014. The mean Z′ (EM)-score recorded the lowest figure of -3.4895 in 2014, which may indicate that the gold mining companies were more financially distressed in 2014. The platinum mining companies recorded a maximum mean Z′ (EM)-score of 2.9592 in 2013 and a minimum score of -1.0283 in 2012. The mean Z′ (EM)-score recorded the highest figure of 2.3958 in 2013 and the lowest figure of 1.0687 in 2014, which may indicate that the platinum mining companies were more financially distressed in 2014. The mean Z′ (EM)-score for both gold and platinum mining companies as depicted table 4 registered a maximum of 1 150.0358 in 2012 and a minimum of -8.1048 in 2014. The mean Z′ (EM)-score also recorded the highest figure of 336.4606 in 2012 and the lowest figure of -1.2104 in 2014, which may indicate that both gold and platinum mining companies were more financially distressed in 2014.
5.2. Hypothesis Testing
The hypothesis of the study was tested by making use of the non-parametric independent-samples Mann-Whitney U test. Tables 5 and 6, and figures 5 and 6 depict the results of the mean rank of the Mann-Whitney U test.
Table 5. Mann-Whitney mean rank test (Model 1)
|
Group |
N |
Mean rank |
Sum of ranks |
Z-score |
Gold mining companies Platinum mining companies Total |
25 25 50 |
21.72 29.28 |
543.00 732.00
|

Figure 5. Independent-samples Matt-Whitney U test (Model 1)
Table 6. Mann-Whitney mean rank test (Model 2)
|
Group |
N |
Mean rank |
Sum of ranks |
Z-score |
Gold mining companies Platinum mining companies Total |
25 25 50 |
21.00 30.00 |
525.00 750.00
|

Figure 6. Independent-samples Matt-Whitney U test (Model 2)
The results presented in tables 5 and 6 and figures 5 and 6 indicate that the gold mining companies have the lowest mean rank of 21.72 and 21.00 respectively as compared to the platinum mining companies which have the highest mean rank of 29.28 and 30.00. This means that the gold mining companies have the lowest Z-score as compared to the platinum mining companies. Tables 7 and 8 depict the Mann-Whitney test statistics.
Table 7. Mann-Whitney test statistics (Model 1)
|
Financial distress as predicted by Altman Z-score |
Total N |
50 |
Mann-Whitney Wilcoxon W Total statistics Standard error Standardised test statistics Asymptotic sig. (2-sided test) |
218.000 543.000 218.000 51.539 -1.834 0.067* |
Table 8. Mann-Whitney test statistics (Model 2)
|
Financial distress as predicted by Altman Z-score |
Total N |
50 |
Mann-Whitney Wilcoxon W Total statistics Standard error Standardised test statistics Asymptotic sig. (2-sided test) |
200.000 525.000 200.000 51.539 -2.183 0.029* |
The results depicted in tables 7 and 8 indicate that the Z-score and the Z′ (EM)-score are statistically significant at 0.067 and 0.029 respectively. Taking into consideration the results presented in tables 5 and table 6, as confirmed by figures 5 and 6, and the results shown in tables 7 and 8, it can be concluded that the gold mining companies have the lowest Z-score ratio compared to the platinum mining companies.
Therefore, the null hypothesis, which states that gold mining companies are more financially distressed than platinum mining companies, is accepted and the alternative hypothesis is rejected. The results obtained in this study are not unique to South African mining companies, but are similar to mining companies in other developing countries. (Saden & Prihatiningtias, 2015; Zlatanovic et al., 2016)
6. Conclusion
Financial distress is a term used in corporate finance to indicate that a company is unable to meet scheduled payments or that cash flow projections indicate that a company will soon be unable to meet scheduled payments. (Brigham & Daves, 2004) The main objective of this study was to assess the state of financial distress of listed gold and platinum mining companies in South Africa. The study adopted two Altman models, namely, the Z-score model (Model 1), which is used often for companies listed on capital markets, and the modified Z′ (EM)-score model (Model 2), which was devised to evaluate non-manufacturers and companies in emerging markets to assess the financial distress of listed gold and platinum mining companies in South Africa.
The non-parametric independent samples Mann-Whitney U-test was conducted to test the hypothesis of the study. The results of the Mann-Whitney mean rank test indicate that the gold mining companies have the lowest mean rank of 21.72 (Model 1) and 21.00 (Model 2) respectively as compared to the platinum mining companies which have the highest mean rank of 29.28 (Model 1) and 30.00 (Model 2). The Mann-Whitney test statistics indicate that the Z-score (Model 1) and the Z′ (EM) -score (Model 2) are statistically significant at 0.067 and 0.029 respectively. Therefore, the null hypothesis, which states that gold mining companies are more financially distressed than platinum mining companies, is accepted and the alternative hypothesis is rejected.
Based on the results obtained, it is evident that gold mining companies in South Africa are more financially distressed than platinum mining companies. This might be the result of the rising cost of production, the strike activities in the mining industry and the decline in gold and platinum prices. This situation has a negative impact on the country’s GDP contribution, earning of foreign currency and employment, because it might result in failure or liquidation of some gold and platinum mining companies.
It is, therefore recommended that management of gold and platinum mining companies should regularly conduct ratio analyses and take corrective actions where necessary to improve the financial health of the companies. Management should also consider hedging as a sanctuary for price volatility. The study conducted by Magee (2013) revealed that hedging in foreign currency reduces a firm’s probability of financial distress. Management should also improve human resource relations with employees to bring stability in the industry. Stability in the industry will improve investor confidence, which will have a positive impact on capital injection into the mining industry and thereby improve the capital structure.
Lastly, management should also consider investing in corporate social responsibility (CSR), which will improve the relationship between employers and employees, thus promoting productivity in the industry. A happy workforce is more productive than a grieved workforce. It is also suggested that management should diversify their operations and start looking at the possibility of opening manufacturing companies that will focus on the beneficiation of gold and platinum locally rather than selling their raw products to overseas companies.
7. References
Altman, E.I. (1968). Financial ratios, discriminant analysis and the prediction of corporate Bankruptcy. Journal of Finance, Vol. 23, pp. 587-609.
Altman, E.I. (2002). Corporate distress prediction models in a turbulent economic and Basel IIenvironment. Working paper, Stern School of Business, NYU. Retrieved from http://pages.stern.nyu.edu/~ealtman/Corp-Distress.pdf, date: 01.13.2016.
Altman, E.I.; Haldeman, R.G. & Narayanan, P. (1977). Zeta analysis, a new model for identifying bankruptcy risk of corporations. Journal of Banking and Finance, Vol. 1, pp. 29-54.
Anglo American News (2015). Anglo American Platinum Limited announces the sale of its Rustenburg Operations for at least R4.5 Billion (Nominal Terms) to Sibanye Gold Limited and Withdrawal of Cautionary Announcement. Retrieved from http://www.angloamerican.com/media/press-releases/2015/03-09-2015, date: 05.13.2016.
Anon (2011). Chapter closes as Aurora gets liquidated. Fin24. Retrieved from http://www.fin24.com/Companies/Mining/Chapter-closes-as-Aurora-gets-liquidated-20111004. date: 05.12.2016.
Beaver, W.H. (1966). Financial ratios as predictors of failure. Journal of Accounting Research, Supplement, pp. 71-127.
Brighm, E.F. & Daves, P.R. (2004). Intermediate Financial Management. 8th Ed. Ohio: Thomson.
Chamber of Mines of South Africa, (2013). Facts and Figures. Retrieved from http://www.chamberofmines.org.za/industry-news/publications/facts-and-figures, date: 07.10.2016.
Chamber of Mines of South Africa (2014). Facts and Figures. Retrieved from http://www.chamberofmines.org.za/industry-news/publications/facts-and-figures, date: 07.10.2016.
Court, P.; Radloff, S. & Van der Walt, O. (1999). A combination of a stationary and a nonstationary model for the prediction of corporate failure a new approach. Unpublished Paper, Rhodes University.
Creamer, M. (2009). Six Pamodzi Gold mines now in provisional liquidation with May 26 return date, Mining Weekly. Retrieved from http://www.miningweekly.com/article/new-may-26-return-date-for-across-board-pamodzi-gold-provisional-liquidation-2009-04-17/rep_id:3650, date: 04.11.2016.
Daya, K. (1977). Financial ratios as predictors of corporate failure in South Africa. Unpublished. MBA research report, Graduate School of Business Administration, University of the Witwatersrand.
De la Rey, J.H. (1981). Finansiële verhoudingsgetalle en die voorspelliing van finansiële mislukking by nywerheidsondernemings in die Republiek van Suid-Afrika. Bureau for Financial Analysis, University of Pretoria.
Elloumi, F. & Gueyie′, J. (2001). Financial distress and corporate governance: an empirical analysis. Corporate Governance: The international journal of business in society, Vol. 1, No. 1, pp. 15-23.
Ferner, D.G. & Hamilton, R.T. (1987). A note on the predictability of financial distress in New Zealand listed companies. Accounting and Finance, Vol. 21, No. 1, pp. 55-63.
Five Year platinum prices in price chart. Retrieved from http://www.infomine.com/investment/metal-prices/platinum/5-year/, date: 07.20.2016.
Gepp, A. & Kumar, K. (2015). Predicting financial distress: a comparison of survival analysis and decision tree techniques. Procedia Computer Science, Vol. 54, pp. 396 - 404.
Gold history prices in charts. Retrieved from http://goldprice.org/gold-price-history.html, date: 07.20.2016.
Gunay, N.E. & Ozkan, M. (2007). Prediction of bank failures in emerging financial markets: An ANN approach. The Journal of Risk Finance, Vol.8, pp. 465-480.
Hlahla, B.F. (2010). Assessing corporate financial distress in South Africa. Unpublished Masters of Management in Finance and Investment thesis, Wits Business School, University of the Witwatersrand. Retrieved from http://www.infomine.com/investment/metal-prices/platinum/5-year/, 07.20.2016.
Janse van Vuuren, A. (2015). Lonmin to cut jobs, close shafts amid platinum slump, Mail&Guardian. Retrieved from http://mg.co.za/article/2015-07-25-more-pain-as-lonmin-to-cut-6000-jobs-close-shafts-amid- platinum-slump, date: 06.11.2016.
Jooste, L. (2007). An evaluation of the usefulness of cash flow ratios to predict financial distress. Acta Commercii, pp. 1-13.
Khaliq, A.; Altarturi, B.H.M.; Thaker, H.M.T.; Harun, M.Y. & Nahar, N. (2014). Identifying Financial distress firms: a case study of Malaysia’s government linked companies (GLC). International Journal of Economics, Finance and Management, Vol. 3, No. 3, pp. 141-150.
Kidane, H.W. (2004). Predicting financial distress in IT and services companies in South Africa. Unpublished MA thesis. Department of Business Management, University of Free State, South Africa.
Ko, L., Blocher, E.J. & Lin, P.P. (2001). Prediction of corporate financial distress: an application of the composite rule induction system. The International Journal of Digital Accounting Research, Vol. 1, No. 1, pp. 69-85.
Lau, A.H. (1987). A five-state financial distress prediction model. Journal of Accounting Research, Spring, pp. 127-138.
Low, S.; Nor, F.M. & Yatim, P. (2001). Predicting corporate financial distress using the logit model: the case of Malaysia. Asian Academy of Managerial Journal, Vol. 6, pp. 49-61.
Loferski, J.P. (2013). US Geological Survey Mineral Yearbook’. Retrieved from http://minerals.usgs.gov/minerals/pubs/commodity/platinum/myb1-2013-plati.pdf, date: 09.12.2014.
Lukhwareni, N. (2005). Dynamics of value drivers amongst persistent wealth creators on the JSE securities exchange South Africa. Unpublished DBL research report, School of Business Leadership, University of South Africa.
Magee, S. (2013). The effect of foreign currency hedging on the probability of financial distress. Accounting and Finance, Vol. 53, No. 4, pp. 1107 - 1127.
Mahama, M. (2015). Assessing the state of financial distress in listed companies in Ghana: Signs, sources, detection and elimination – A test of Altman’s Z-Score. European Journal of Business and Management, Vol. 7, No. 3, pp. 1-10.
Matthews, C. (2014). Provisional liquidation of gold mine affects hundreds. Financial Mail, Retrieved from http://www.financialmail.co.za/features/2014/03/27/provisional-liquidation-of-gold-mine-affects-hundreds, date: 04.11.2016.
Miller, W. & Harrington, J.P. (2009). A timely new study of bankruptcy prediction model from Morningstar. Business Valuation Update, Vol 15, No. 4, pp. 1-6.
Mining news (2015). Lonmin warns of 2bn write down, 6000 job cuts. Retrieved from http://www.minimng.com/lonmin-warns-of-write-down-6000-job-curs/, date: 05.14 2016.
Mining-technology.com (2015). Aglo American to sell Rustenburg Operations in South Africa to Sibanye Gold. Retrieved from http://www.mining-technology.com/news/newsanglo-american-sell-rustenburg-operat, date: 05.12.2016.
Mohammed, A.A.E. & Kim-Soon, N. (2012). Using Altman’s model and current ratio to assess the financial status of companies quoted in the Malaysian Stock Exchange. International Journal of Scientific and Research Publications, Vol. 2, No. 7, pp. 1-11.
Muller, G.H.; Steyn-Brewer, B.W. & Hamman, W.D. (2009). Predicting financial distress of companies listed on the JSE – A comparison of techniques. South African Journal of Business Management, Vol. 40, No. 1, pp. 21-32.
Naidoo, S.R. & du Toit, G.S. (2007). A predictive model of the states of financial health in South African businesses. Southern African Business Review, Vol. 11, No. 3, pp. 32-55.
Moeljadi, K.N. & Indrawati, N.K. (2014). Prediction of financial distress of mining companies listed in BEI using financial variables and non-financial variables. European Journal of Business and Management, Vol. 6, No. 34, pp. 226-236.
Ohlson, J.A. (1980). Financial ratios and probabilistic prediction of bankruptcy. Journal of Accounting Research, Spring, pp. 109-131.
Premachandra, J.M., Chen, Y. & Watson, J. (2011). DEA as a tool for predicting corporate failure and success: A case of bankruptcy assessment. Omega, Vol. 39, pp. 620-626.
Saden, N.S. & Prihatiningtias, Y.W. (2015). Financial distress prediction of mining companies listed in Indonesian Stock Exchange: An analysis using Altman Z-score model. Jurnal IImiah Mahasiswa FEB, Vol. 4, No. 1, pp. 1-15. Retrieved from http://jimfeb.ub.ac.id/index.php/jimfeb/article/view/2411, date: 04.13.2016.
South African Year Book (2012/13). Mineral Resources. Retrieved from http://www.gcis.gov.za/content/resourcecentre/sa-info/yearbook2012-13, date: 01.11.2015.
Statistics South Africa. Central Statistical Service (2014). Statistical release. P0043. Pretoria: Central Statistics Service. Retrieved from
http://www.statssa.gov.za/publications/P0043/P0043February2014.pdf, date: 02.16.2016.
Statistics South Africa. Central Statistical Service (2015a). Statistical release. P4252. Pretoria: Central Statistics Service. Retrieved from http;//www.statssa.gov.za/?p=4252, date: 05.13.2016.
Statistics South Africa. Central Statistical Service (2015b). Statistical release. P4622. Pretoria: Central Statistics Service. Retrieved from http://www.statssa.gov.za/?p=4622, date: 10.10.2016.
Statistics South Africa. Central Statistical Service (2016). Statistical release. P0277. Pretoria: Central Statistics Service. Retrieved from: http://www.statssa.gov.za/publications/P0277/P0277June2016.pdf, date: 12.10. 2016.
Shah, N. (2014). Developing financial distress prediction models using cutting edge recursive partitioning techniques: a study of Australian mining performance. Review of integrative business and economics, Vol. 3, No. 2, pp. 103-143.
Shetty, U.; Pakkala, T.P.M. & Mallikarjunappa, T. (2012). A modified directional distance formulation of DEA to assess bankruptcy: An application to IT/ITES companies in India. Expert Systems with Applications, Vol. 39, pp. 198-197.
van Rooyen, D. (2015). JSE massacre wipes out Lonmin market capitalisation. Fin24. Retrieved from http://www.fin24.com/Markets/Equities/jse-massacre-wipes-out-lonmin-market-capitalisatio-20151120, 06.16.2016.
Ward, T.J. (1994). An empirical study of the incremental predictive ability of Beaver’s naïve operating flow measure using four-state ordinal models of financial distress. Journal of Business and Accounting, Vol. 21, No. 4, pp. 547-561.
Xu, K.; Zhao, Q. & Bao, X. (2015). Study on early warning of enterprise financial distress-based on partial least-squares logistic regression. Acta Oeconomica, Vol. 65, No. 2, pp. 3-16.
Yende, S.S. (2016). Lily Gold Mine can be rescued, City Press, Retrieved from http://city-press.news24.com/Business/lily-gold-mine-can-be-rescued-20160519, date: 06.03.2016.
Zlatanovic, D.; Bugarin, M.; Milisavljevic, V. & Zlatanovic, V. (2016). Forecasting the financial distress of mining companies: tools for testing the key performance indicators. Mining and Metallurgy Institute BOR, Vol. 1, pp. 73-80.
Annex 1. Results of Z-Score computation of gold mines (Model 1)
|
2015 |
2014 |
2013 |
2012 |
2011 |
DRD Gold |
|||||
X1 |
0.146395 |
-1.559 |
0.074595 |
0.005259 |
0.841097 |
X2 |
0.080105 |
-1.7281 |
0.006801 |
0.001463 |
0.741342 |
X3 |
0.161301 |
-1.51349 |
0.419772 |
0.001789 |
0.777381 |
X4 |
0.100948 |
-1.57145 |
0.33539 |
0.003691 |
0.707859 |
X5 |
0.050878 |
-1.83423 |
0.187107 |
0.002819 |
1.087973 |
Z-Score |
-1.30566 |
-1.6585 |
-0.90847 |
-1.04423 |
-1.71553 |
Anglo Gold |
|||||
X1 |
0.10738 |
-0.60307 |
156.9349 |
0.85418 |
3.510056 |
X2 |
0.088691 |
-0.47086 |
253.0579 |
0.84212 |
-5.9541 |
X3 |
0.128719 |
-0.43579 |
275.8769 |
1.072288 |
-211.607 |
X4 |
0.071637 |
-0.0867 |
396.7534 |
2.567346 |
63.27806 |
X5 |
0.182224 |
-0.24838 |
563.3479 |
4.546337 |
129.8872 |
Z-Score |
160.8035 |
247.5637 |
65.03489 |
462.5837 |
697.7153 |
Gold Field |
|||||
X1 |
0.070232 |
0.34473 |
0.136463 |
0.000525 |
-0.03397 |
X2 |
0.066442 |
0.347974 |
0.140599 |
0.000849 |
0.00175 |
X3 |
0.072032 |
0.221052 |
0.131924 |
0.000587 |
-0.07979 |
X4 |
0.181023 |
0.236236 |
0.326908 |
0.001303 |
0.026366 |
X5 |
0.028652 |
0.220844 |
0.506562 |
0.001809 |
0.083371 |
Z-Score |
-0.03397 |
0.00175 |
-0.07979 |
0.026366 |
0.083371 |
Sibanye Gold |
|||||
X1 |
-0.11024 |
-0.48528 |
0.257374 |
0.001032 |
0.025363 |
X2 |
-0.07006 |
-0.49625 |
0.446912 |
0.001046 |
0.055566 |
X3 |
-0.0532 |
-0.73294 |
0.651619 |
0.000698 |
0.084642 |
X4 |
-1.19898 |
-0.60054 |
0.511576 |
0.000251 |
0.151266 |
X5 |
-1.44488 |
-0.79402 |
0.771056 |
0.000242 |
0.138664 |
Z-Score |
-0.31175 |
-0.06279 |
-0.04918 |
-1.13643 |
-1.32894 |
Harmony Gold |
|||||
X1 |
0.049478 |
-0.20758 |
0.021369 |
0.003259 |
-0.10682 |
X2 |
0.076075 |
-0.02816 |
-0.04174 |
0.000926 |
-0.11099 |
X3 |
0.068455 |
0.017306 |
0.029383 |
0.001833 |
-0.03007 |
X4 |
0.086611 |
0.107171 |
0.069056 |
0.002283 |
-0.06211 |
X5 |
0.02295 |
0.038405 |
0.173431 |
0.004608 |
0.051526 |
Z-Score |
-0.24029 |
-0.10389 |
0.086903 |
0.203015 |
0.29092 |
Annex 2. Results of Z-Score computation of platinum mines (Model 1)
|
2015 |
2014 |
2013 |
2012 |
2011 |
Anglo American |
|||||
X1 |
0.169468 |
0.28371 |
0.005939 |
0.003178 |
-0.16163 |
X2 |
0.078249 |
0.424645 |
0.043885 |
0.005059 |
0.006858 |
X3 |
0.104365 |
0.42473 |
0.10673 |
0.005882 |
-0.01519 |
X4 |
0.084631 |
0.463734 |
-0.23411 |
0.007313 |
-0.07699 |
X5 |
0.043622 |
0.564768 |
0.290794 |
0.010184 |
0.040767 |
Z-Score |
0.300662 |
0.558696 |
0.626517 |
0.244578 |
0.950136 |
Lonmin |
|||||
X1 |
0 |
-0.26124 |
-0.22165 |
0.001588 |
-0.61635 |
X2 |
0.152188 |
0.360054 |
0.030867 |
0.019528 |
-0.04187 |
X3 |
0.107243 |
0.397586 |
0.122193 |
0.033658 |
0.036373 |
X4 |
0.045105 |
0.359143 |
0.047845 |
0.017646 |
-0.08872 |
X5 |
0.059524 |
0.469606 |
0.204167 |
0.039946 |
0.053964 |
Z-Score |
-1.09765 |
0.0520762 |
0.697053 |
0.381016 |
0.827207 |
Impala |
|||||
X1 |
0.113045 |
0.566981 |
-0.00363 |
0.00114 |
-0.04802 |
X2 |
0.127637 |
0.612398 |
0.014792 |
0.001306 |
-0.04586 |
X3 |
0.163991 |
0.613756 |
0.044194 |
0.002457 |
9.91E-05 |
X4 |
0.125771 |
0.673697 |
0.13495 |
0.002769 |
0.014072 |
X5 |
0.143355 |
0.700595 |
0.26859 |
0.004362 |
0.061278 |
Z-Score |
0.629511 |
0.710269 |
0.824497 |
0.951259 |
1.17818 |
Northam |
|||||
X1 |
0.196809 |
0.082817 |
0.049702 |
0.002567 |
-0.08632 |
X2 |
0.064818 |
0.209124 |
0.132109 |
0.006919 |
-0.06959 |
X3 |
0.015818 |
0.215133 |
0.01404 |
0.007511 |
0.000657 |
X4 |
0.004913 |
0.184833 |
0.172002 |
0.010204 |
0.041076 |
X5 |
0.155549 |
0.159468 |
0.093391 |
0.007518 |
0.025946 |
Z-Score |
0.245574 |
0.343384 |
0.25316 |
0.413028 |
0.441872 |
Royal Bafokeng |
|||||
X1 |
0.08874 |
0.09111 |
-0.02692 |
0.003031 |
-0.15409 |
X2 |
0.143501 |
0.257956 |
0.102381 |
0.005959 |
0.018759 |
X3 |
0.098369 |
0.261593 |
0.081987 |
0.007234 |
0.013652 |
X4 |
0.102005 |
0.251119 |
0.039088 |
0.007371 |
0.008472 |
X5 |
0.132229 |
0.246731 |
0.078248 |
0.00748 |
0.014026 |
Z-Score |
0.001864 |
0.528556 |
0.462836 |
0.408055 |
0.478714 |
Annex 3. Results of Z′(EM)-Score computation of gold mines (Model 2)
|
2015 |
2014 |
2013 |
2012 |
2011 |
DRD Gold |
|||||
X1 |
0.792972 |
0.433901 |
0.873715 |
0.546802 |
0.275587 |
X2 |
-3.63025 |
-4.02401 |
-3.52428 |
-3.65923 |
-4.27113 |
X3 |
0.151902 |
0.013849 |
0.854808 |
0.682977 |
0.381017 |
X4 |
0.003884 |
0.0036 |
0.00386 |
0.004832 |
0.002988 |
Z-Score |
-2.681492 |
-3.572658 |
-1.791892 |
-2.424614 |
-3.611539 |
Anglo Gold |
|||||
X1 |
0.581643 |
0.480411 |
0.697227 |
0.388033 |
0.987048 |
X2 |
-1.40428 |
-1.09644 |
-1.01476 |
-0.20188 |
-0.57836 |
X3 |
319.5766 |
515.3179 |
561.7857 |
807.9342 |
1147.181 |
X4 |
1.343027 |
1.202588 |
1.221743 |
2.061809 |
2.445907 |
Z-Score |
320.096963 |
515.904424 |
562.689864 |
810.182128 |
1150.035803 |
Gold Field |
|||||
X1 |
0.38041 |
0.359894 |
0.390175 |
0.980544 |
0.1552 |
X2 |
0.802729 |
0.810282 |
0.514735 |
0.550093 |
0.51425 |
X3 |
0.277889 |
0.286312 |
0.268645 |
0.665703 |
1.031545 |
X4 |
0.001156 |
0.00151 |
0.001622 |
0.001764 |
0.001878 |
Z-Score |
1.462195 |
1.457997 |
1.175176 |
2.198104 |
1.702873 |
Sibanye Gold |
|||||
X1 |
-0.59712 |
-0.37947 |
-0.28819 |
-6.49449 |
-7.82643 |
X2 |
-1.13002 |
-1.15556 |
-1.7067 |
-1.39841 |
-1.84893 |
X3 |
0.524107 |
0.910074 |
1.3269434 |
1.041756 |
1.57015 |
X4 |
0.001284 |
0.001324 |
0.001273 |
0.000458 |
0.000442 |
Z-Score |
-1.201746 |
-0.623640 |
-0.666682 |
-6.850681 |
-8.104776 |
Harmony Gold |
|||||
X1 |
0.268008 |
0.412075 |
0.3708 |
0.469144 |
0.12431 |
X2 |
-0.48336 |
-0.06557 |
0.040297 |
0.249556 |
0.089428 |
X3 |
0.043514 |
-0.08501 |
0.059834 |
0.140622 |
0.353169 |
X4 |
0.006597 |
0.007335 |
0.007579 |
0.008754 |
0.007324 |
Z-Score |
-0.165238 |
0.268836 |
0.478510 |
0.868076 |
0.574231 |
Annex 4. Results of Z′(EM)-Score computation of platinum mines (Model 2)
|
2015 |
2014 |
2013 |
2012 |
2011 |
Anglo American |
|||||
X1 |
0.917951 |
0.423846 |
0.565311 |
0.458418 |
0.236283 |
X2 |
0.660639 |
0.988817 |
0.989014 |
1.079837 |
1.315103 |
X3 |
0.012093 |
0.089367 |
0.217341 |
-0.47672 |
0.592163 |
X4 |
0.004527 |
0.004882 |
0.004833 |
0.005267 |
0.006963 |
Z-Score |
1.595211 |
1.506912 |
1.776500 |
1.066800 |
2.150511 |
Lonmin |
|||||
X1 |
0 |
0.82435 |
0.5809 |
0.244318 |
0.322422 |
X2 |
-0.60831 |
0.838411 |
0.925807 |
0.836291 |
1.093512 |
X3 |
-0.45136 |
0.062856 |
0.24883 |
0.097431 |
0.415758 |
X4 |
0.031342 |
0.062736 |
0.068199 |
0.042035 |
0.061727 |
Z-Score |
-1.028329 |
1.788353 |
1.823735 |
1.220074 |
1.893419 |
Impala |
|||||
X1 |
0.612329 |
0.691368 |
0.888285 |
0.681262 |
0.776505 |
X2 |
1.320255 |
1.426013 |
1.429176 |
1.568752 |
1.631386 |
X3 |
-0.0074 |
0.030122 |
0.08995 |
0.274807 |
0.546947 |
X4 |
0.003436 |
0.003578 |
0.003398 |
0.004245 |
0.004362 |
Z-Score |
1.928623 |
2.151081 |
2.410854 |
2.529065 |
2.959199 |
Northam |
|||||
X1 |
1.066049 |
0.3511 |
0.085683 |
0.026614 |
0.842557 |
X2 |
0.192845 |
0.486961 |
0.500953 |
0.430396 |
0.371333 |
X3 |
0.10121 |
0.269021 |
0.028591 |
0.350258 |
0.190179 |
X4 |
0.002751 |
0.008614 |
0.008147 |
0.01519 |
0.014971 |
Z-Score |
1.362856 |
1.115695 |
0.623374 |
0.822459 |
1.419039 |
Royal Bafokeng |
|||||
X1 |
0.480675 |
0.777299 |
0.532833 |
0.552526 |
0.716238 |
X2 |
0.212155 |
0.60067 |
0.609139 |
0.584748 |
0.57453 |
X3 |
-0.05482 |
0.208486 |
0.166955 |
0.079598 |
0.159342 |
X4 |
0.011336 |
0.014376 |
0.01542 |
0.015606 |
0.016256 |
Z-Score |
0.649343 |
1.600830 |
1.324347 |
1.232479 |
1.466366 |
1 Professor, Department of Finance, Risk Management and Banking, University of South Africa, Address: P.O Box 392, UNISA, 0003, Pretoria, South Africa, Corresponding author: ngwenms@unisa.ac.za.
AUDŒ, Vol. 14, no. 4, pp. 655-677
Refbacks
- There are currently no refbacks.

This work is licensed under a Creative Commons Attribution 4.0 International License.